Position: N/A
| After enduring a sharp 10-week long decline in the spring
of 2012 -- one that saw Morgan Stanley (MS) shares shed more than 42%
of their value -- this key financial sector stock managed to put in a
strong, well-spaced double-bottom pattern (between June 4 and July 23,
2012), attracting the interest of value-conscious smart money interests
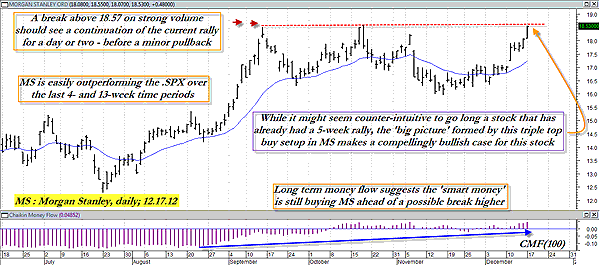
as it did so. Now, five months later, MS is up by more than 50% and is rapidly closing in on what could be an explosive triple-top buy signal, one that could lead to even more gains in the stock as 2012 fades out and 2013 arrives. Here's a closer look now (see Figure 1). |

|
| FIGURE 1: MS, DAILY. Triple-top buy patterns are infrequent, but they can sometimes lead to powerful continuation moves. Note how bullish that Morgan Stanley's long-term money flow trend is on this daily chart. |
| Chart pattern trading can be a valuable technical analysis
timing tool, particularly when an attractive pattern -- such as the
beautiful triple-top buy signal you see above -- is put into a big
picture context that includes at least several of the following
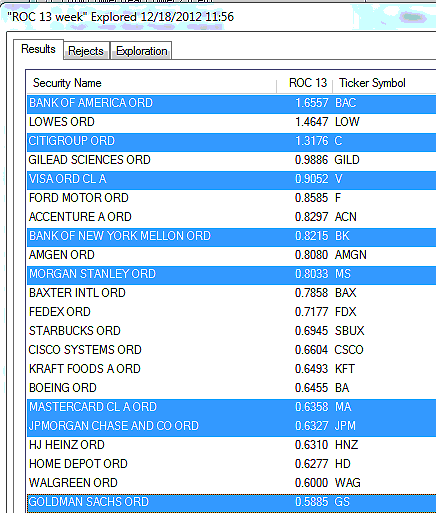
confirming market dynamics: 1. The four- and 13-week relative strength of the stock versus the .SPX, .NDX, and/or .RUT. See Figure 2. 2. The long-term money flow trend of the stock -- using an 89- to 110-day Chaikin money flow histogram. 3. The six- to 12-month earnings growth projections for the stock. Check for recent upward/downward revisions in earnings growth rates. 4. The price cycles for the stock; the more that agree with the projected breakout of the chart pattern, the more reliable the breakout is likely to be. There are other tools that can be used, of course, but using these four is a great place to start, especially when dealing with a very large pattern that may offer a substantial profit opportunity. In the case of MS, the stock scores very favorably in each of those four categories, and the next big event to watch for is a break above 18.57, which is the October 18, 2012 high of the second of the three tops shown on the chart. We've all heard the phrase "third time's a charm," and in this instance, it's going to be positive fundamentals and technicals (rather than sheer luck) that will power MS higher in the days ahead, playing MS here on the long side, possibly weeks ahead. |

|
| FIGURE 2: SPX. Many financial sector stocks in the Standard & Poor's 100 are outperforming the .SPX over the past 13 weeks, including Morgan Stanley. |
| Playing MS here on the long side isn't too complicated, but you
definitely need to decide what your trading objectives are, since there
is a high probability of a pullback to retest the 18.50 to 19.00 area
(depending on how powerful the break higher might be), traders using 30-
to 60-minute charts might find any number of good entry points after a
pullback and may be able to ride them higher for one to three days. Intraday scalpers might simply go for a 25- to 50-cent gain on a break above 18.57, being careful to use a very close stop if they do. Finally, traders could simply buy a January '13 MS $17.50 covered call -- selling for about 17.27 as this is written -- intending to hold the position through option expiration on January 19, 2013. Using the 21-day exponential moving average (EMA) (blue line on Figure 1) can help give you an objective trailing stop for the entire position; if you see MS make a daily close below it, you simply liquidate both sides (remember, you're long 100 shares of stock and short one call option when you put on a covered call) of the position. Risking 2% or less of your account equity can also help limit the damage to your portfolio on trades that simply don't work out, as risk control is a critical component in the long-term success of any kind of trading endeavor. Trade wisely until we meet here again. |
No comments:
Post a Comment
Note: Only a member of this blog may post a comment.